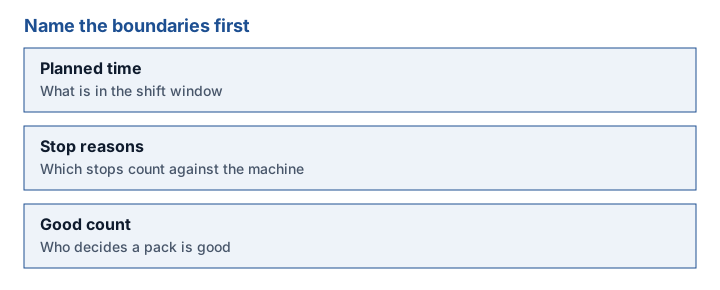
A percentage on a dashboard is easy to argue about and hard to reconstruct. Before anyone collects an overall equipment effectiveness figure, write the clocks and the counts in words.
ISO 22400-2:2014 is the document titled as definitions and descriptions of KPIs for manufacturing operations management. This page does not restate those definitions. The ISO page that names the standard was not available as full text on 14 October 2026, so the formula is not copied from memory. Use the standard itself for the official terms. The checklist below is an editorial list of boundaries that have to be explicit whatever formula you later apply.
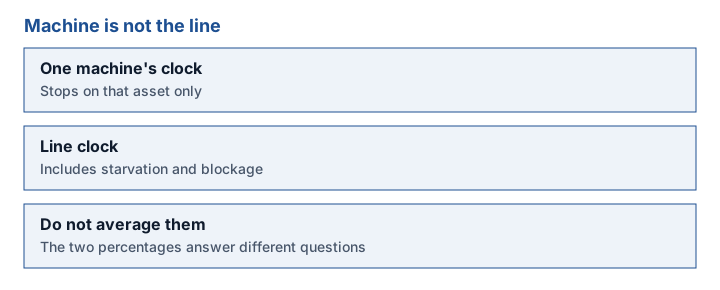
Separate the machine from the line
A stop because the upstream machine ran out of product is not the same event as a stop inside the machine you are measuring. If both are folded into one percentage, a mechanic and a planner will disagree about the cause and both can be looking at a true count. Keep a machine view and a line view. PackML, in OMAC’s description, is a way to expose consistent machine data. It does not decide your planned-time rule.
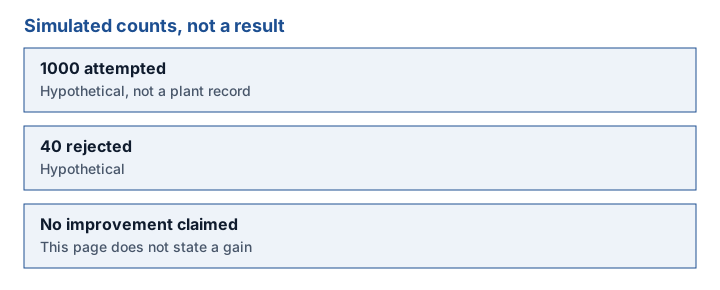
A simulated count, labelled as such
Suppose a hypothetical shift attempts 1000 packs and rejects 40. Those numbers are not from a factory. They only show that “good” has to be defined before the 40 can be used. This page does not claim that collecting the data raises output.
Read line buffers for the rate boundary and vision reject verification for how a reject is confirmed. The section home is Packaging Automation.
Method and sources
ISO 22400-2:2014 is cited by its published title only. OMAC’s PackML page was read for the machine-data boundary. No improvement percentage is stated.