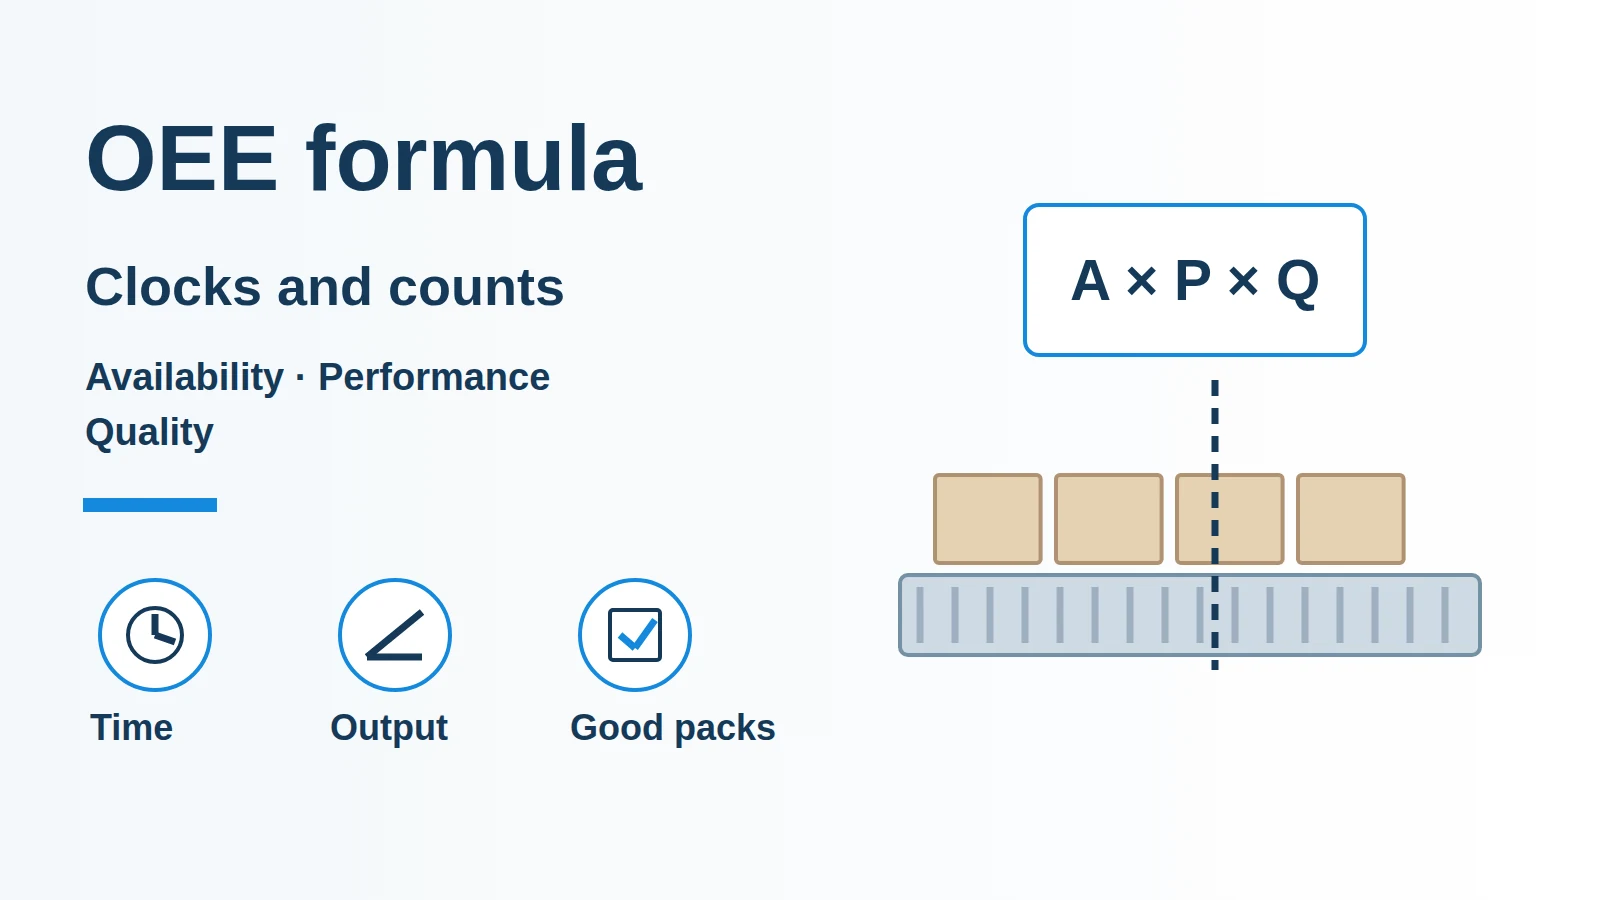
Unreconciled stops and counts make an OEE result impossible to audit. The OEE formula multiplies availability, performance and quality; the retrieved ISO 22400-2:2014 text calls the performance factor effectiveness.
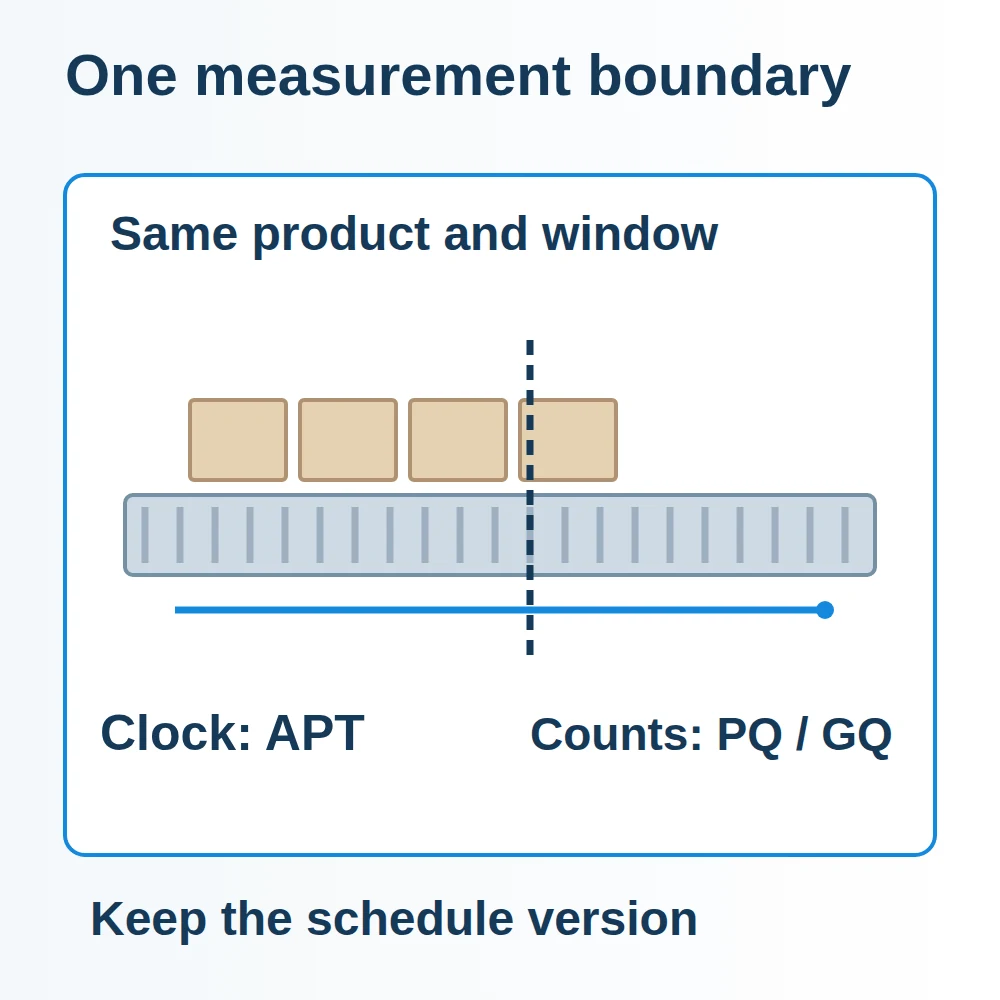
Calculate all three factors for the same work unit, product and observation window. Availability compares production time with planned busy time, performance uses planned runtime per item and produced quantity, and quality compares good with produced quantity. Preserve those inputs beside the result so an engineer can trace a changed figure to a changed clock, count or reference. Start with the OEE data collection boundaries before implementing the calculation.
Which definitions belong in the OEE formula?
Use the three ratios in Tables 9–11 of the retrieved ISO 22400-2:2014 public text, with the multiplication in Table 7. Here A means availability, P means the effectiveness factor, and Q means quality ratio.
| Input or item | Typical value or source | Why it matters |
|---|---|---|
| A = APT / PBT | Table 9; APT is actual production time, PBT planned busy time | Fix the clock boundary |
| P = PRI × PQ / APT | Table 10; PRI is planned runtime per item, PQ produced quantity | Preserve the product reference |
| Q = GQ / PQ | Table 11; GQ is good quantity | Reconcile inspection with production |
The same text defines PBT as planned operation time less planned downtime; APT includes value-adding production functions. PRI is planned time per quantity unit. GQ meets quality requirements; PQ is output associated with a production order. These are the retrieved definitions, rather than assumptions about what a dashboard vendor labels “running.”
Formula: OEE = A × P × Q = (APT / PBT) × (PRI × PQ / APT) × (GQ / PQ).
For a common, nonzero set of denominators this reduces algebraically to OEE = PRI × GQ / PBT. Use consistent time and quantity units. The expanded form retains diagnostic value even when the final arithmetic cancels two inputs.
How should the counters reconcile?
Reconcile counter increments before calculating a ratio. Store the opening and closing readings, reset events, product identity and inspection disposition together; do not subtract readings across an unexplained reset.
Counter formula: produced quantity = closing production counter − opening production counter.
Worked example — hypothetical count audit: PQ = 1,040 packs − 40 packs = 1,000 packs; if 40 of those packs fail the stated acceptance check and none is pending, GQ = 1,000 − 40 = 960 packs. These are arithmetic inputs, not a measured factory OEE result or an improvement claim.
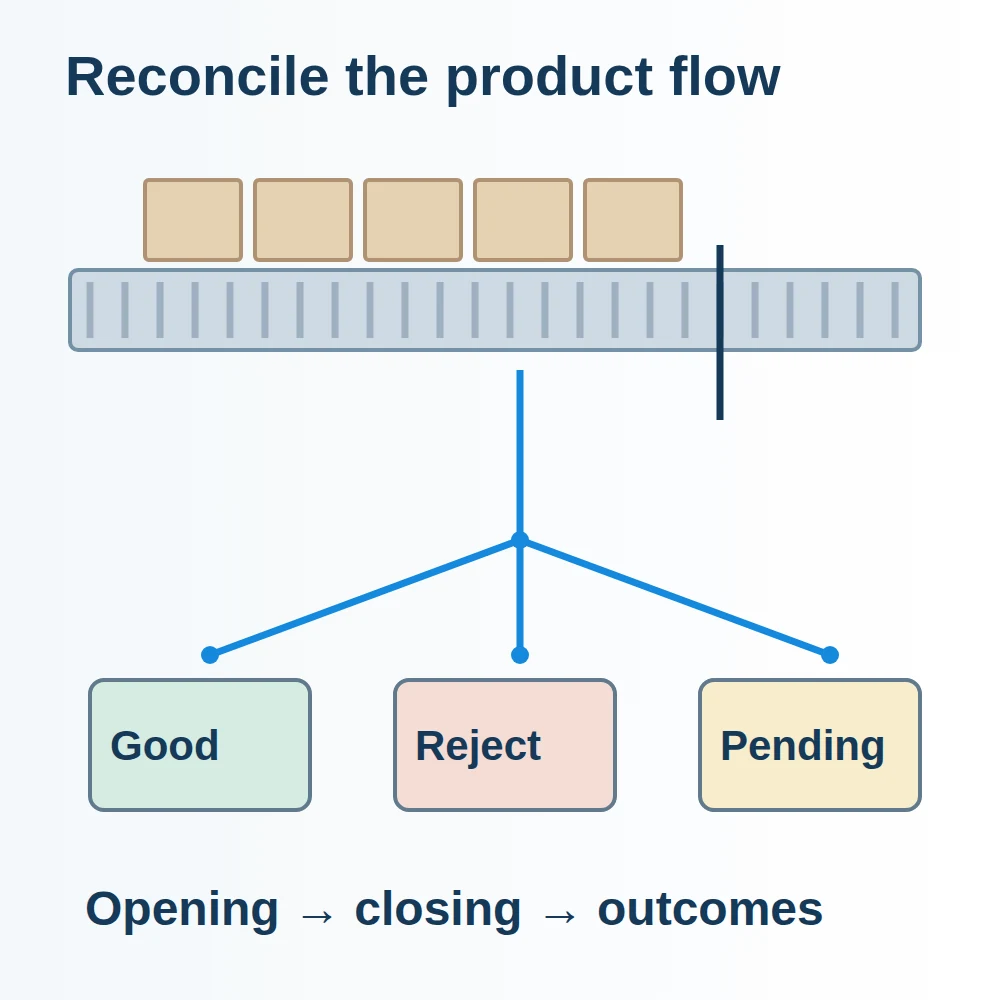
Hold an incomplete inspection window open or publish its status as provisional. If a pack is still pending, do not quietly count it as good. For mixed products, preserve each product’s PRI and quantity before combining results; one unqualified average can hide a changed product mix. Never average displayed percentages without reconstructing their underlying denominators.
Where do the dominant failures enter?
The most useful prevention is a traceable event at the point where a clock or count changes. The following are engineering implementation checks, rather than additional ISO definitions.
| Measurement boundary | Evidence to retain | Dominant Failure Mode & Prevention |
|---|---|---|
| Planned busy window | Schedule version and approved exclusions | Retroactive stop exclusion changes the denominator; freeze the schedule version |
| Production clock | Timestamped state transitions | A stale running bit accumulates false time; reconcile state changes with local events |
| Produced counter | Counter value, reset marker and unit identity | Sensor bounce or a reboot duplicates packs; use validated edge capture and reset handling |
| Good counter | Accepted identity and inspection decision | An unconfirmed reject enters good output; reconcile the reject actuator and confirmation sensor |
Physical threshold rule: if the polling interval is greater than or equal to the shortest low gap between successive product-sensor pulses, a polling collector can miss the separation between packs. Use an edge counter or latched event capture and validate the input filter against measured pulse widths. This is a sampling constraint, not an OEE target or a machine cycle-time specification.
The vision reject verification guide explains the distinction between deciding to reject and confirming removal. For state interpretation, preserve the separate machine and line views described in PackML machine states.
Keep a time ledger beside the percentage
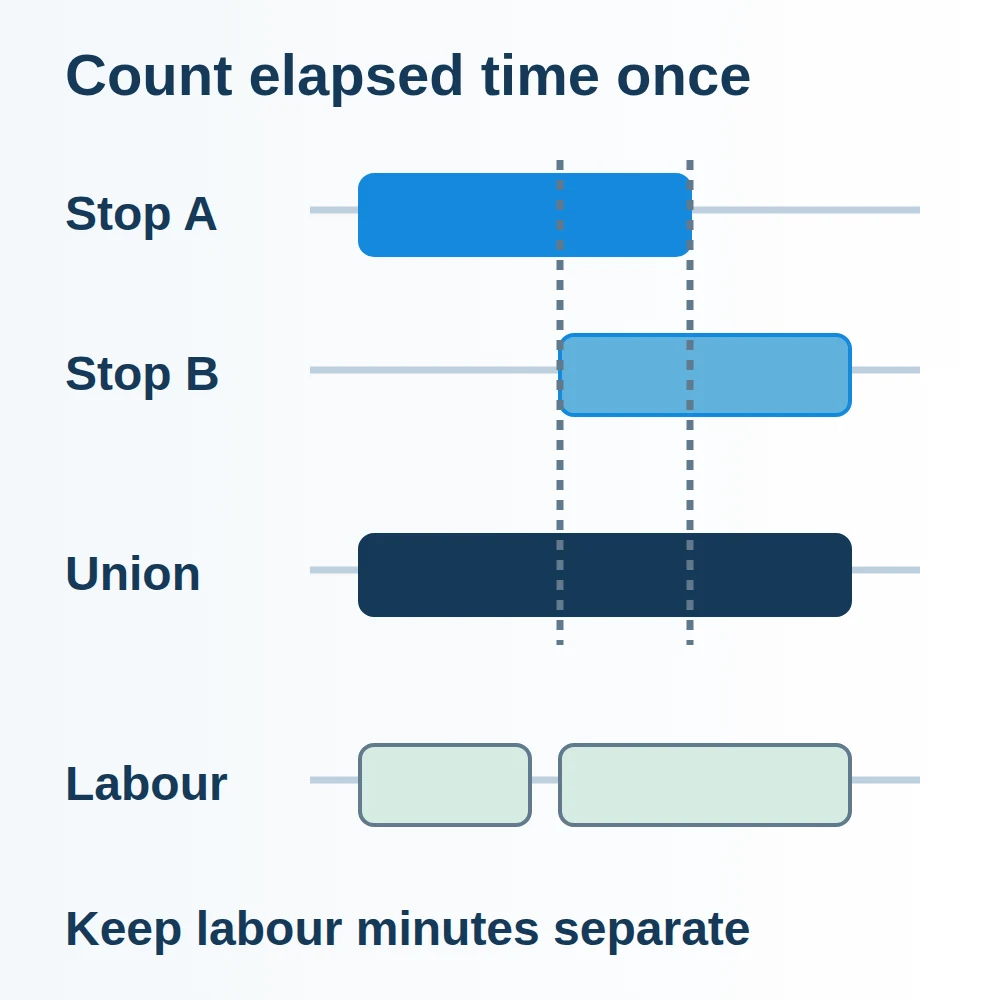
A time ledger makes lost production opportunity and recovery effort visible without promising a universal saving. Record start and end timestamps, the equipment boundary, overlapping events and who restored the flow.
| Ledger entry | Time and cost basis | Next engineering check |
|---|---|---|
| Internal stop | Nonoverlapping elapsed minutes; repair labour separately | Machine state transitions |
| Starved or blocked | Elapsed minutes tagged with upstream or downstream cause | Line buffers and handoffs |
| Reject recovery | Event duration, packs discarded and labour minutes | Reject confirmation |
| Collection fault | Missing interval and reconciliation labour | OEE collection boundaries |
Ledger formula: total elapsed interruption = duration of the union of interruption intervals. Add durations only after removing overlaps. Two technicians working on the same stop create two labour records but one elapsed interval; rejected packaging creates a material cost record as well. This separation prevents a time ledger from double-counting loss or disguising recovery labour as extra production downtime.
Method and sources
The ISO public record establishes the standard’s identity and scope. Definitions and ratios above use the retrieved public standards text, particularly its time and quantity elements and Tables 7 and 9–11. Counting, sampling and ledger checks are engineering applications; the count example is explicitly hypothetical. No benchmark OEE percentage is proposed. Updated October 2026.