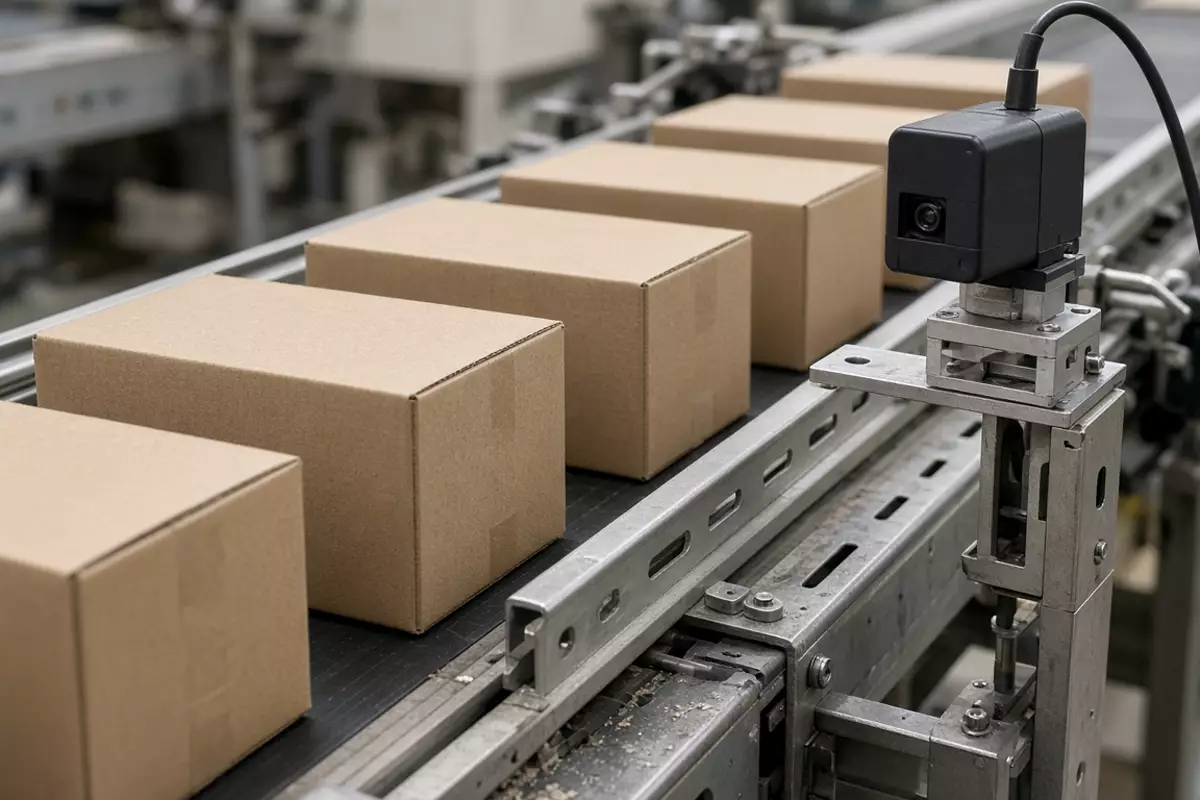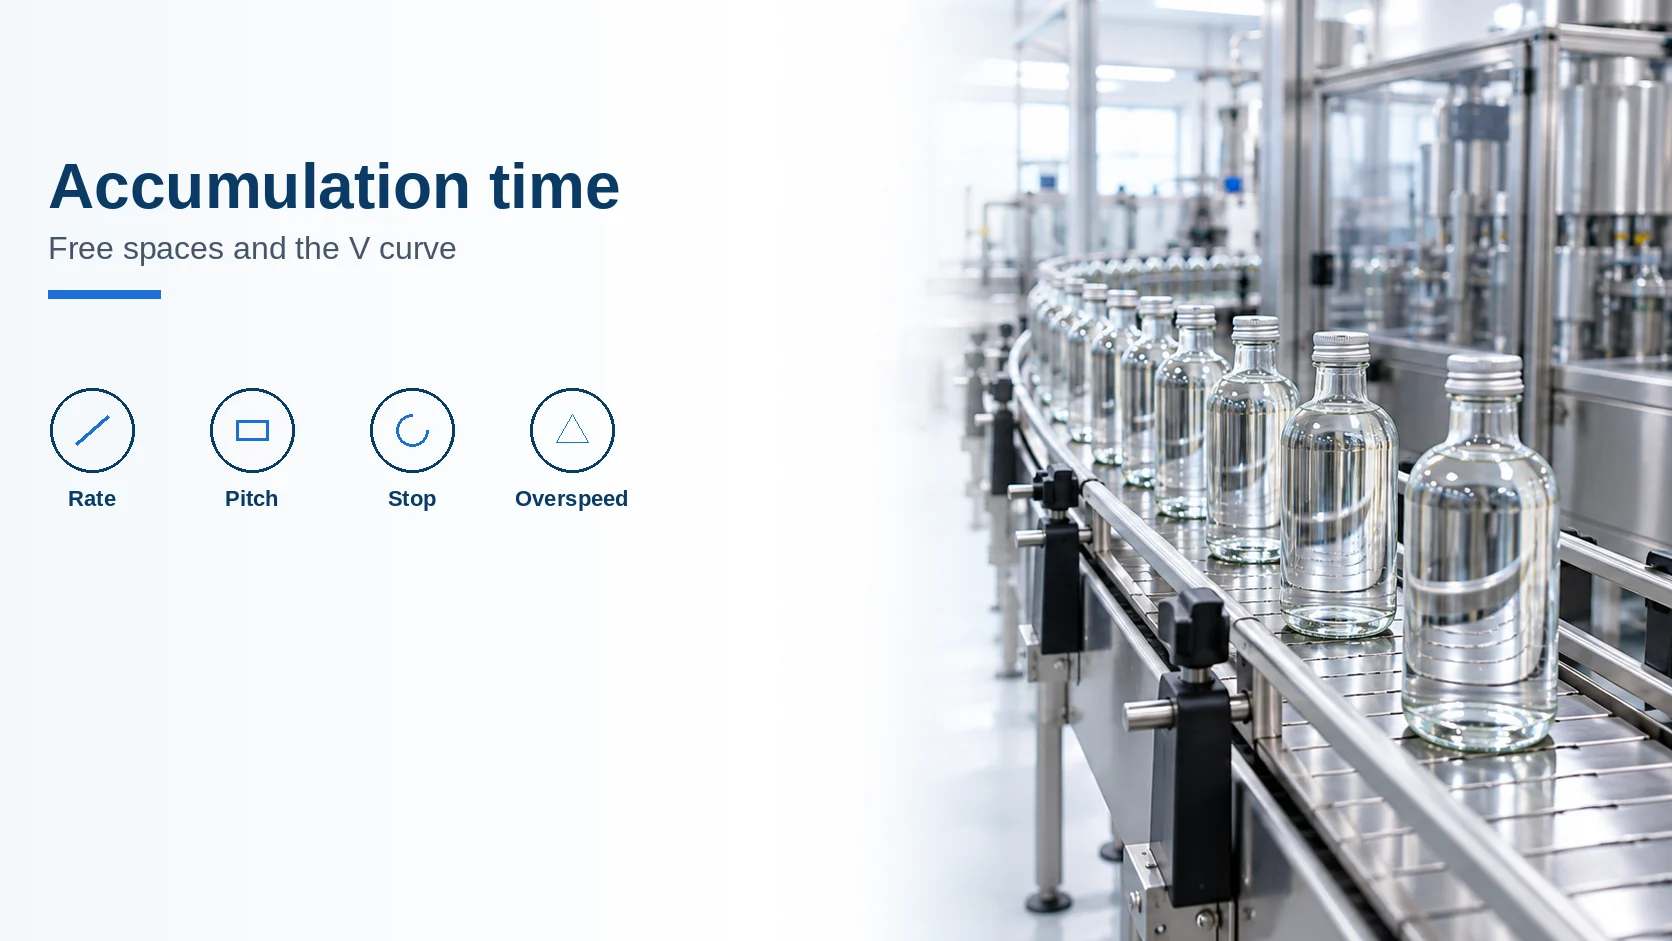
A short label change becomes filler downtime when the conveyor has no free space. Every container that keeps leaving the filler needs an empty position, or the filler blocks.
Free positions are the buffer. While the machine downstream is stopped and nothing leaves, the arrival count is the incoming rate times the stop duration. Automated Quality Solutions writes that count as packages per minute times seconds of stoppage, divided by 60, then rounded up. Conveyor length is that count times pitch. The V curve then decides whether a faster labeler can empty the queue before the next stop. Signals between the machines stay in line buffers and handoffs. This page is the count.
| Job of the buffer | What sets the number | Dominant failure mode | Prevention |
|---|---|---|---|
| Hold arrivals during a downstream stop | Rate times stop time, rounded up | Treating conveyor feet as the capacity | Convert feet to positions with the accumulated pitch |
| Keep the critical machine fed during an upstream stop | Positions already full, divided by the downstream rate | Assuming an empty table can feed anyone | Record occupancy at the moment the upstream machine stops |
| Clear the queue after the stop | Speed gap between the bottleneck and the next machine | Running both machines at the same speed | Apply a stated overspeed and a measured time to the next stop |
| Choose static or dynamic storage | Lot trace and floor space | A last-in table on a lot-traced product | Use dynamic first-in storage when the lot has to stay in order |
How many free spaces cover a stop
Automated Quality Solutions’ accumulation calculator, read on 20 October 2026, sizes the conveyor for every package that arrives while the downstream machine is stopped. Accumulated pitch is product length plus the gap the products settle to when they close up.
N = ceil(R × t / 60)
L = N × p
R is packages per minute, t is the stop in seconds, N is whole packages, p is accumulated pitch, and L is length in the same unit as p. Their time check runs the other way: whole packages that fit, divided by the rate, times 60, gives seconds. They round the product count up when they size length, and down when they report time, so the stated buffer is never short of a package.
Their worked example is 40 packages per minute, a 12 inch product, and a 30 second stop.
40 × 30 / 60 = 20 packages.
With no settled gap, 20 × 12 in = 20 ft. With a 2 inch settled gap the pitch is 14 inches and the length is 23.3 ft. A 24 ft conveyor at a 12 inch pitch holds 24 packages, which is 36 seconds at 40 packages per minute. Zero-pressure zones, in that same note, are the length divided by the zone length, rounded up, and the zone has to be at least the pitch or the packages push.
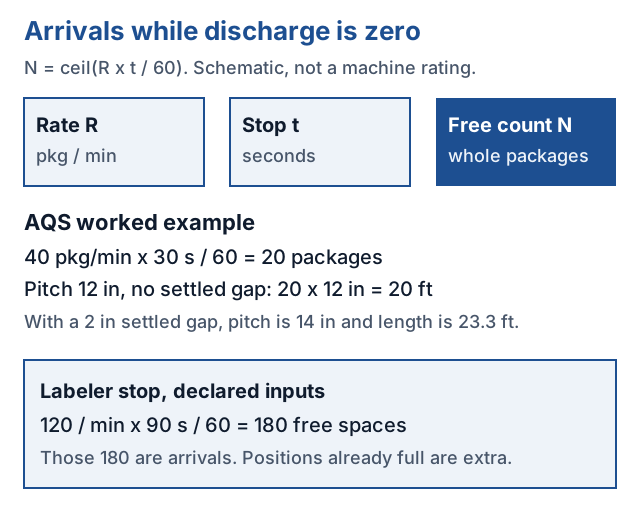
Apply the same arrival formula to a labeler stop. These inputs are declared for the arithmetic, not a survey of label changes. The filler keeps discharging at 120 containers per minute. The stop to cover is 90 seconds. Discharge from the buffer is zero during that stop.
N = ceil(120 × 90 / 60) = 180 free spaces.
Those 180 spaces are the containers that arrive. If 40 positions are already full when the labeler stops, the table needs 180 empty positions on top of those 40, or the filler blocks before 90 seconds. End occupancy, if nothing leaves, is 220. Pitch then turns 220 positions into length. A round bottle’s pitch is the diameter plus the settled gap, measured on the table you have, not taken from the 12 inch carton example.
Rule of thumb: if the empty positions at the moment of the stop are fewer than ceil(R × t / 60), the upstream machine blocks before that stop ends. At 120 per minute and 90 seconds, the threshold is 180 empty positions.
The Winter Simulation Conference paper by Browning, Ball, Peretz, and Wilkes (2024) states a separate starting band used by packaging designers: 2 to 3 minutes of buffer at the bottleneck rate, or 1.5 times the estimated mean time to repair when that repair time is known. Two minutes at 120 per minute is 240 containers. Three minutes is 360. A 90 second label change sits inside a 2 minute buffer only when those positions are empty and discharge stays at zero. The paper also says there is no simple equation for the efficiency gain, and that extra buffer time brings diminishing returns. Their study varied three buffers from 0 to 4 minutes, in 30 second steps, on a project whose filler ran 450 bottles per minute. That project result is not a rating you can paste onto a 120 per minute line.
The V curve is a set of machine speeds
Zenith Global’s white paper for Sidel, filed as Sidel document 11914, describes the production-line V curve. The critical machine sits at the bottom. Machines before it and after it are designed to run faster. In their example the critical machine is the filler. A faster depalletizer pushes a constant supply toward the filler. Faster equipment downstream pulls, so a queue built during a short stop can leave and free the accumulation before the next stop. The white paper is dated 2 September 2019 and points to DIN 8743 for the full efficiency formulas. This page uses Zenith’s description of the V and their stated series example. It does not quote DIN 8743, because that standard text was not the file retrieved here.
The Haskell authors use the same picture and call it V-theory. The V means the bottleneck is chosen on purpose, and buffers plus speed differences insulate it from micro-stops. To clear the buffers they say a speed differential is required, typically 10 to 15 percent of the speed of the machine nearer the bottleneck, or a gap large enough to clear the buffer in one mean time between failures.
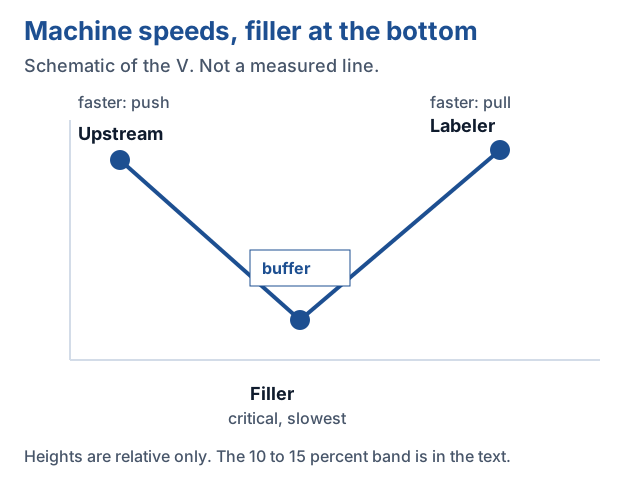
Take the filler as the machine nearer the bottleneck, at 120 containers per minute, and use the top of the stated band, 15 percent.
Speed gap = 0.15 × 120 = 18 containers per minute.
The labeler then runs at 138 per minute while it is clearing, and the filler stays at 120. The 180 containers that arrived in the 90 second stop leave according to:
t_clear = 180 / 18 = 10 minutes.
A 90 second stop therefore leaves a 10 minute recovery at a 15 percent gap. Ten percent would be a gap of 12 per minute and a clear time of 180 / 12 = 15 minutes. The buffer buys the stop. The speed gap buys the recovery. If the next stop arrives before the queue is gone, the empty-position count for that next stop is whatever remains, not the original 180.
Rule of thumb: if the time until the next stop is shorter than N / (0.15 × R), a 15 percent gap does not restore an empty buffer. Either lengthen the time between stops or widen the speed gap until gap = N / MTBF, which is the paper’s other setting. For N = 180 and an MTBF of 10 minutes, that gap is 18 per minute, the same 15 percent of 120.
Zenith also separates static accumulation (a table or a crate store, often last-in) from dynamic accumulation (a driven conveyor that can run first-in). They prefer dynamic storage where lot trace matters, including food, personal care, and home care. A last-in table can satisfy the 180-position count and still scramble the lot. The position count does not choose the table type.
What an uncovered stop costs
Zenith’s theoretical comparison, not a plant trial, puts five machines at 97 percent each. With no accumulation they multiply the five figures.
0.97 × 0.97 × 0.97 × 0.97 × 0.97 = 0.8587, which they state as 85.8 percent line performance.
On their 10,000 unit per hour line, the gap between 97 percent and 85.8 percent is:
10,000 × (0.97 − 0.858) = 1,120 units per hour.
They value that gap at €1.2 per unit and spread it over 24 hours a day, 5 days a week. 1,120 × 24 × 5 × 48 = 6,451,200 units, and 6,451,200 × 1.2 = 7,741,440 euros in their table. The euro figure stands only inside those assumptions: a buyer for every extra unit, a constant margin, and 48 such weeks. It is not a quote and not a reason to buy a named accumulator.
The direct count for one missed labeler stop is smaller and local. At 120 per minute, 90 seconds of filler blockage is 180 containers that were not filled. Four such uncovered stops in an hour are 720 containers, which is 720 / (120 × 60) = 0.10 of that hour. Use four only when the line’s own stop log shows four. The OEE formula is where that blocked time meets availability, and the OEE data page is where the clock is defined. Downstream of the labeler, the handoff into the case packer is a different boundary, covered in case packing and palletizing.
Where this count stops
The arrival formula assumes discharge is zero for the whole stop and the rate stays constant. A labeler that creeps, a reject lane, or a split changes the rate that actually reaches the buffer. Automated Quality Solutions says their line-flow simulator uses the rate that survives splits, merges, and rejects. The standalone calculator does not. Parallel machines and a manual pack-off are outside the single-file pitch.
Zenith says the DIN 8743 efficiency formulas are more involved than a five-machine product, and tells the reader to size accumulation with a line designer rather than with the white paper alone. Browning and co-authors say the same about efficiency: buffer helps, and the gain is not a fixed percent per extra minute. Their 2 to 3 minute band is a start. It is not the output of the 450 bottle-per-minute meta-model, and that meta-model is not this conveyor.
PackML, as the machine-state page uses it, names states. It does not return N. Keep the state word and the position count in separate columns. Section home: Packaging automation.
Method and sources
Arrival count, pitch, the 40 package example, the 20 ft length, the 23.3 ft length with a 2 inch gap, and the 36 second check on a 24 ft conveyor come from the Automated Quality Solutions calculator page, retrieved 20 October 2026. The V-curve description, the static and dynamic distinction, the five-machine product stated as 85.8 percent, and the 10,000 unit model come from the Zenith Global white paper hosted by Sidel (document 11914). The 2 to 3 minute band, the 1.5 times repair-time alternative, the 10 to 15 percent speed gap, the one-MTBF clearing rule, the 450 bottle-per-minute study, and the statement that efficiency has no simple buffer equation come from Browning, Ball, Peretz, and Wilkes, Winter Simulation Conference 2024. The 180-space and 10-minute figures are this page’s arithmetic on declared inputs. No conveyor model is named, because none of these sources supplies a model number this guide needs.